Below is a TradingView Pine Script version 5 strategy that implements the requested trading logic. The strategy enters long positions at 0.05 daily ATR below the last low and short positions at 0.05 daily ATR above the last high, with take profit at 0.2 ATR and stop loss at 0.05 ATR. It also draws the last high, last low, entry point, stop loss, and take profit levels while in a position.
Strategy Details
- Long Entry: Enter at 0.05 * daily ATR below the last low.
- Short Entry: Enter at 0.05 * daily ATR above the last high.
- Take Profit: 0.2 * daily ATR from entry price.
- Stop Loss: 0.05 * daily ATR from entry price.
- Visualization: Plot last high, last low, entry price, stop loss, and take profit levels only when in a position.
- Assumptions:
- Daily ATR is calculated using the ta.atr() function with a 14-period length on daily timeframe data.
- Last high/low are determined using ta.highest() and ta.lowest() over a lookback period (default 20 bars).
- The strategy uses strategy.entry() and strategy.exit() for precise trade management.
- Notes:
- The script avoids repainting by confirming the last high/low on the previous bar.
- Plots are conditional to reduce clutter, showing only when in a position.
- No additional filters or conditions are applied unless specified.
Go to Strategy Writer and enter this prompt (https://t.me/quantellics_tvs_bot)
Create a tradingview version 5 strategy that enters long at 0.05 daily atr bellow last low and take profit at 0.2 atr with stop loss 0.05 atr. It enters short at 0.05 daily atr above last high and take profit at 0.2 atr with stop loss 0.05 atr. Draw last high, last low, entry point, stop loss and take profit while in position.
Click Generate Strategy
Copy the strategy text:
// @version=5
strategy("ATR Breakout Strategy", overlay=true, margin_long=100, margin_short=100)

// Input parameters
atr_length = input.int(14, "ATR Length", minval=1)
lookback = input.int(20, "Lookback Period", minval=1)

// Calculate daily ATR
atr_daily = request.security(syminfo.tickerid, "D", ta.atr(atr_length))

// Calculate last high and last low
last_high = ta.highest(high[1], lookback)
last_low = ta.lowest(low[1], lookback)

// Entry levels
long_entry = last_low - atr_daily * 0.05
short_entry = last_high + atr_daily * 0.05

// Stop loss and take profit distances
stop_loss_distance = atr_daily * 0.05
take_profit_distance = atr_daily * 0.2

// Position status
var float long_stop = na
var float long_tp = na
var float short_stop = na
var float short_tp = na
var float entry_price = na

// Long entry condition
if (close < long_entry and strategy.position_size == 0)
    strategy.entry("Long", strategy.long)
    entry_price := close
    long_stop := entry_price - stop_loss_distance
    long_tp := entry_price + take_profit_distance

// Short entry condition
if (close > short_entry and strategy.position_size == 0)
    strategy.entry("Short", strategy.short)
    entry_price := close
    short_stop := entry_price + stop_loss_distance
    short_tp := entry_price - take_profit_distance

// Exit conditions
if (strategy.position_size > 0)
    strategy.exit("Long Exit", "Long", stop=long_stop, limit=long_tp)
if (strategy.position_size < 0)
    strategy.exit("Short Exit", "Short", stop=short_stop, limit=short_tp)

// Plot last high and last low
plot(strategy.position_size != 0 ? last_high : na, "Last High", color=color.red, style=plot.style_dashed)
plot(strategy.position_size != 0 ? last_low : na, "Last Low", color=color.green, style=plot.style_dashed)

// Plot entry, stop loss, and take profit when in position
plot(strategy.position_size > 0 ? entry_price : na, "Long Entry", color=color.blue, style=plot.style_circles)
plot(strategy.position_size > 0 ? long_stop : na, "Long Stop Loss", color=color.red, style=plot.style_crosses)
plot(strategy.position_size > 0 ? long_tp : na, "Long Take Profit", color=color.green, style=plot.style_crosses)

plot(strategy.position_size < 0 ? entry_price : na, "Short Entry", color=color.blue, style=plot.style_circles)
plot(strategy.position_size < 0 ? short_stop : na, "Short Stop Loss", color=color.red, style=plot.style_crosses)
plot(strategy.position_size < 0 ? short_tp : na, "Short Take Profit", color=color.green, style=plot.style_crosses)
How to Use
- Add to TradingView:
- Open TradingView and go to the Pine Editor.
- Copy the script above and paste it into the editor.
- Click “Add to Chart” to apply the strategy.
- Configure Inputs:
- ATR Length: Default is 14 (standard ATR period). Adjust if needed.
- Lookback Period: Default is 20 bars for determining last high/low. Modify based on your timeframe or market.
- Backtesting:
- Use TradingView’s Strategy Tester to evaluate performance on your chosen symbol and timeframe.
- Adjust parameters or add filters (e.g., time-based or trend-based) if desired.
- Visualization:
- When in a position, the chart will display:
- Last High: Red dashed line.
- Last Low: Green dashed line.
- Entry Price: Blue circles.
- Stop Loss: Red crosses.
- Take Profit: Green crosses.
- These plots disappear when no position is open to keep the chart clean.
- When in a position, the chart will display:
Notes and Limitations
- Timeframe: The strategy uses daily ATR, so ensure the chart timeframe is compatible (e.g., 1H, 4H). Lower timeframes may require adjusting the lookback period.
- Market Suitability: Test the strategy on your chosen market, as volatility and ATR vary across assets.
- No Additional Filters: The script follows your exact requirements without extra conditions (e.g., trend filters). You can request modifications if needed.
- Repainting Avoidance: The script uses previous bar data ([1]) for last high/low to prevent repainting, but real-time performance depends on market conditions.
- Brokerage Fees: The strategy doesn’t account for commissions or slippage. Adjust in the Strategy Tester settings for realistic backtesting.
If you need modifications (e.g., additional filters, different visualization styles, or specific timeframe logic), please let me know, and I can update the script with the same artifact_id for continuity.
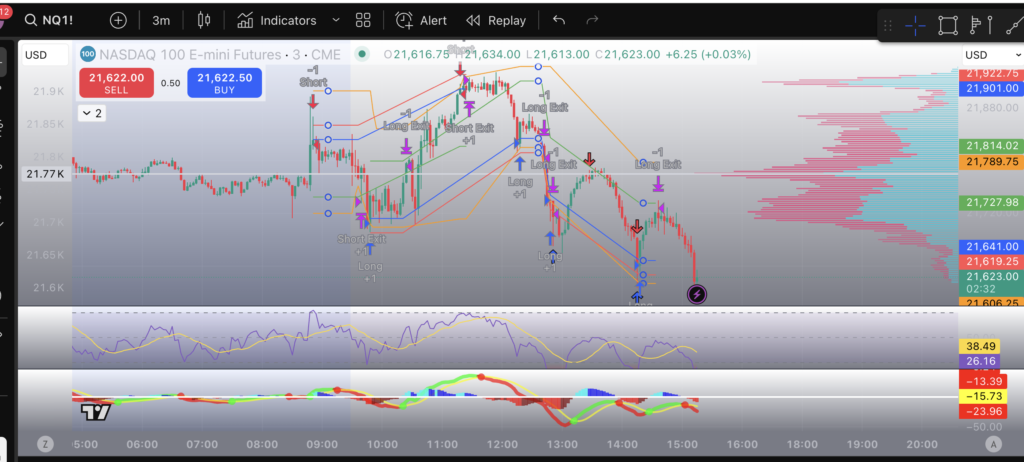
NQ daily trades example
Back Testing Results
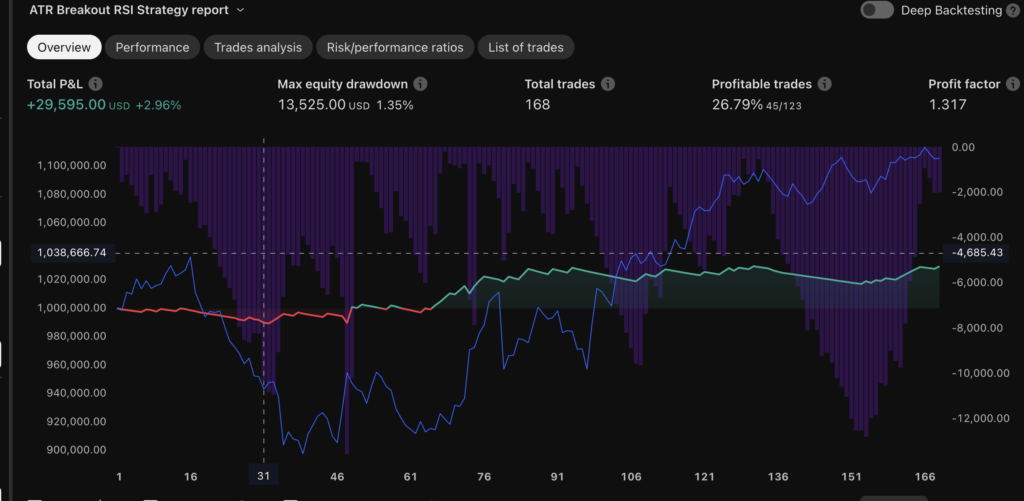
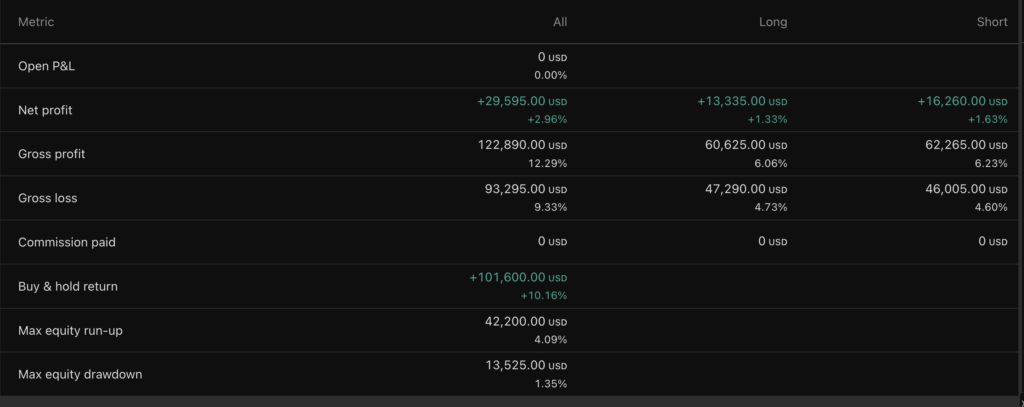
Performance
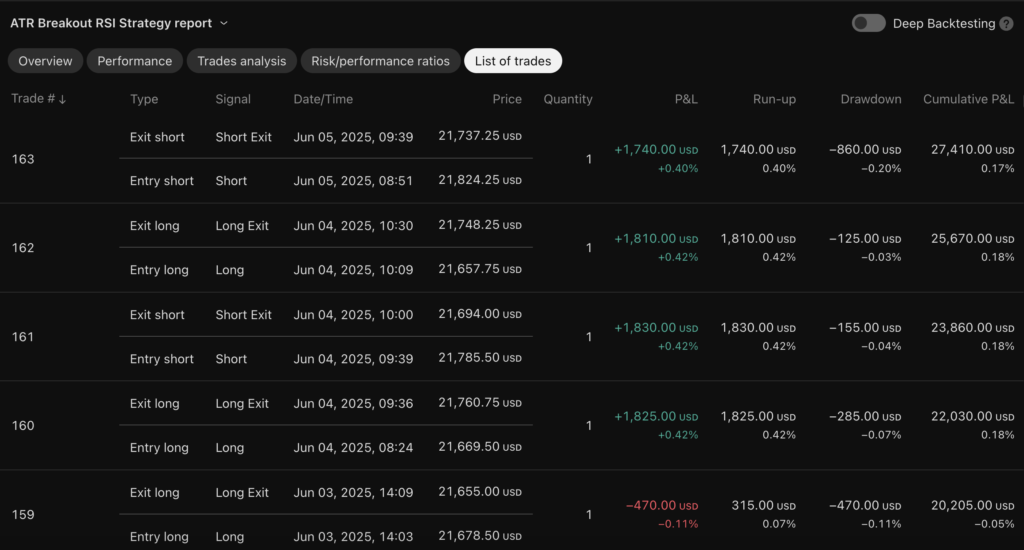
Example Trades